SIM Flow Chart Module "Active Chart"
ActivChart allows the representation and activation of Emergency Procedure and Accident Management Guideline Charts (EPG/SAG) as active screens made and activated by the user. During an accident simulation the activation highlights the path that the accident has taken in the procedure, the decisions and actions that have been taken and the decisions and actions that need to be evaluated or taken now. Chart screens can be set up (1) as a complete chart with a zoom and scroll feature to move to portions of the chart outside the displayed segment, or (2) as fixed screens showing a segment of the total chart and with jumps linking the segment displayed to the remaining chart segments.
The SIM Chart Module can be used in three basic ways:
- In the manual mode an accident progression is followed on the SIM Charts as it would be on a paper copy, except that the SIM Chart keeps track of the path, actions and decisions taken. Each path decision is made by the user on the basis of the current value of the decision parameters in the SIM simulation and the indicated operator actions are carried out interactively by the user in the screens. The manual mode is primarily considered for training and for emergency drills, but it can also be used for development, testing and validation of SAMG procedures.
- In the automatic mode the path decisions are programmed by the user by providing the appropriate inputs for the Chart module and they will be automatically decided and indicated on the Charts on the basis of the current values of the decision parameters during a simulation. All operator actions required by the Charts are also programmed by the user by providing the appropriate inputs. Operator actions are then also carried out automatically at the appropriate time during a simulation. Time delays for both the path decisions and for the operator actions are also input by the user to represent the time that the accident management team would require to implement the decision or action during an accident. The automatic modus is primarily considered for development, testing, validation of SAMG procedures and for the preparation of training scenarios and emergency drills.
- A third mode, the automatic decision mode is also available, where the path decisions are taken automatically but the required actions are carried out interactively in the screens
The SIM Flow Chart includes the following animation:
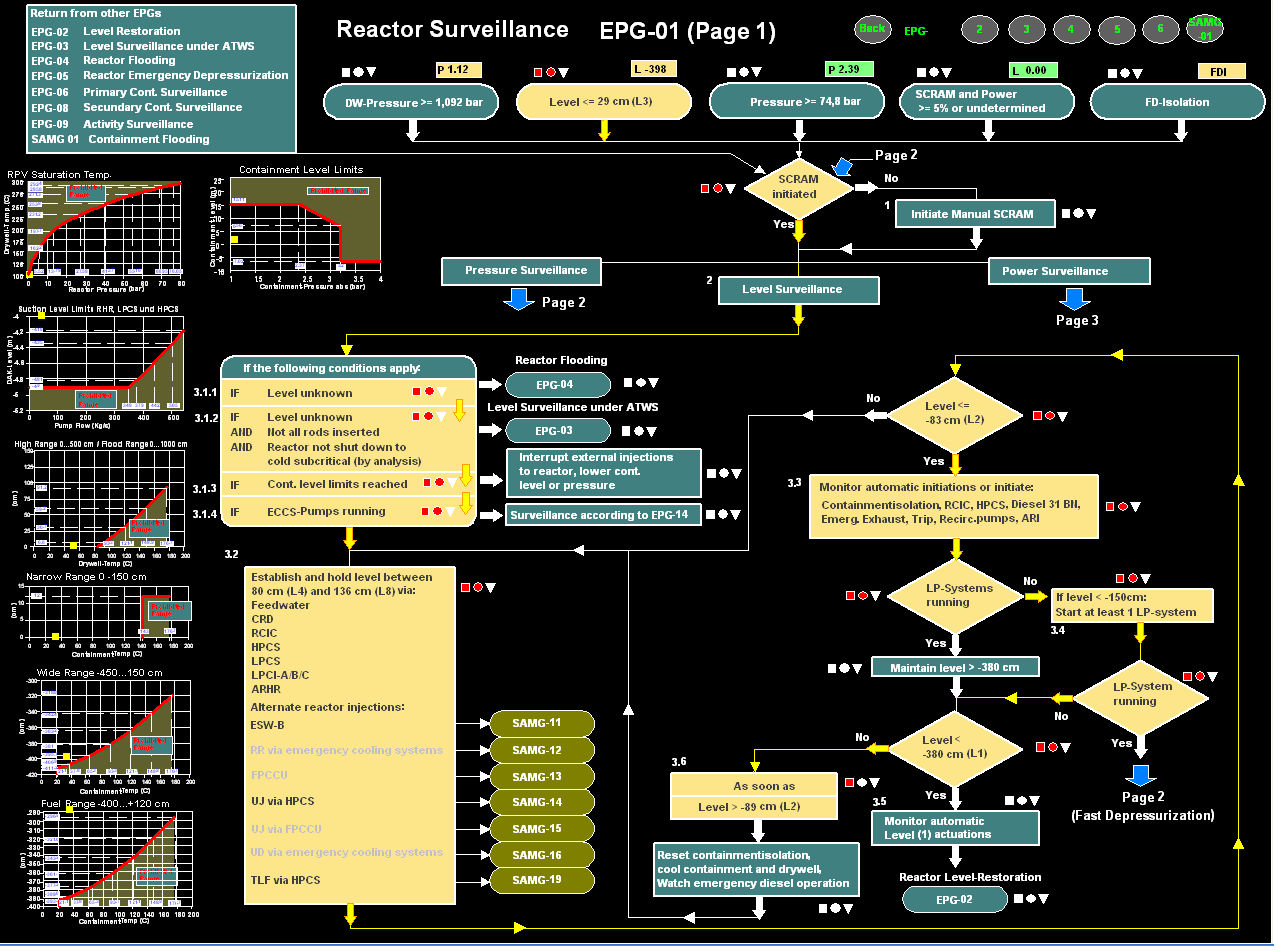
- Trigger Boxes (chart elements that represent a threshold condition): Trigger Boxes light up in color when the trigger condition occurs. The box color flashes on and off until it is acknowledged by the user when it changes to solid color. In manual mode, the chart path continues after acknowledgement. The box fill color clears when the trigger condition resets, leaving a color outline to indicate that the condition had occurred, but is no longer active.
- Chart Path: The activated path through the flow chart is highlighted in heavy yellow. When the path segment is no longer active (for example because of an action taken) the path changes to a different color to indicate that the path was activated, but has since cleared.
- Action Boxes: Action Boxes indicate operator actions to be taken when a certain condition is reached in the accident progression. Action Boxes flash in a distinctive color when the condition occurs. When the operator acknowledges the condition, flashing stops but the box color remains. In the “manual action” mode the operator takes the appropriate actions in the interactive system screens. When the action is taken the color fill changes to a color outline to indicate that the condition has occurred and the action has been taken. In the “automatic action” mode, the operator actions indicated by an Action Box are “executed” automatically when the trigger condition occurs. The automatic mode helps the training manager in developing or testing a chart or to prepare a training scenario because he does not have to sit in front of the computer and watch for the trigger conditions and take the actions manually and interactively when they occur. Time delays and other user defined parameter settings are set by the user. The “automatic action” mode applies to actions that are modeled as automatic operator actions.
- Yes/No Decision Boxes: Yes/No Decision Boxes indicate points in the chart where the chart path takes a different direction based on the condition of a specific parameter. In the “manual decision” mode the decision box flashes in color when a path decision has to be made (when a yellow path line reaches a decision box). The user now selects the “Yes” or “No” path based on the conditions presented to him in the plots and screens. When he selects a path exit the flashing stops but the box fill remains colored. When the decision condition is no longer satisfied, the fill color resets and a color outline remains to indicate that the decision had been taken before. In the “automatic decision” mode the Yes or No out path from a decision box is selected automatically based on the decision parameter’s value in the simulation. There are both single decision boxes (i.e. diamonds) and multiple stacked decision boxes.
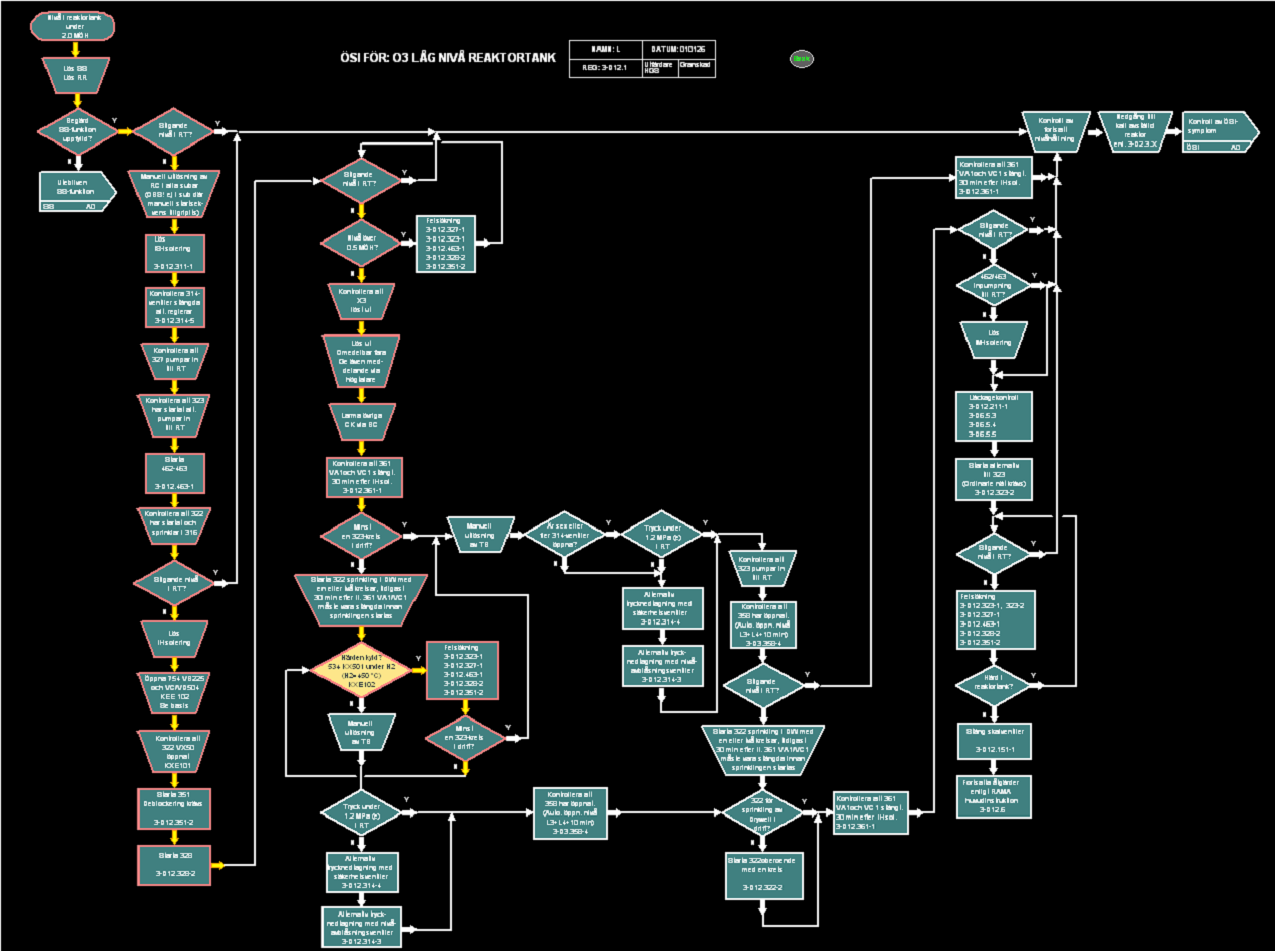
- Chart Display Mode: Typical EPG/SAG flow charts can be too large to fit on a single screen in an easily readable manner. The user can choose to develop the chart screens in one of two display modes: (a) complete charts with zoom and scroll control, or (b) flow chart segments with transfer jumps to move to other segments.
- Parameter Windows: Dynamic windows can show the current value of trigger parameters in the chart.
- Embedded Graphs: Graphs embedded in the charts or grouped on a graph page are activated and show the trace and the current location of the graph parameters. Embedded small graph icons can be double clicked to enlarge the graph in a separate window.
- Transfer Buttons: Transfer Buttons allow transfer to other EOP/SAG Charts. When a flashing condition occurs in one of the other EOP/SAG Chart the transfer button flashes. The transfer occurs when the operator clicks on the transfer button and the flashing in the transfer button stops.
- User-defined Colors: All colors are set in ScreenBuilder by the user and can be changed. The user can set up standard color boxes and save them in the component window for multiple use.
- Chart Mode: The chart feature works by default in the all manual (training) mode. The user can set the automatic actions mode and the automatic decision mode separately in the SIM.INI file and/or configuration dialog.
- Procedure Icon: Each Chart can have an icon which brings the full step by step procedure text up on the screen when clicked. This requires procedure in a compatible electronic form (pdf, word, etc.).
- Chart Feature Driven by Plant Instrumentation: The activated charts can be set up on a new or existing computer in the main control room or in a different location, and they are driven directly by digital plant instrumentation signals with the same logic and automatic decision mode, but without interactions or automatic operator actions.
Sample Charts